Where in the US Has the Poorest Mental Health?
Mental health has typically taken a back seat to physical health, but that has begun to change in recent years. More doctors are now screening their patients for mental health struggles during routine checkups, and there are more mental health services available to help those who need them. With health professionals and society putting more of an emphasis on mental health, many people have become more willing to be open about struggling with mental health and seeking help to improve it.
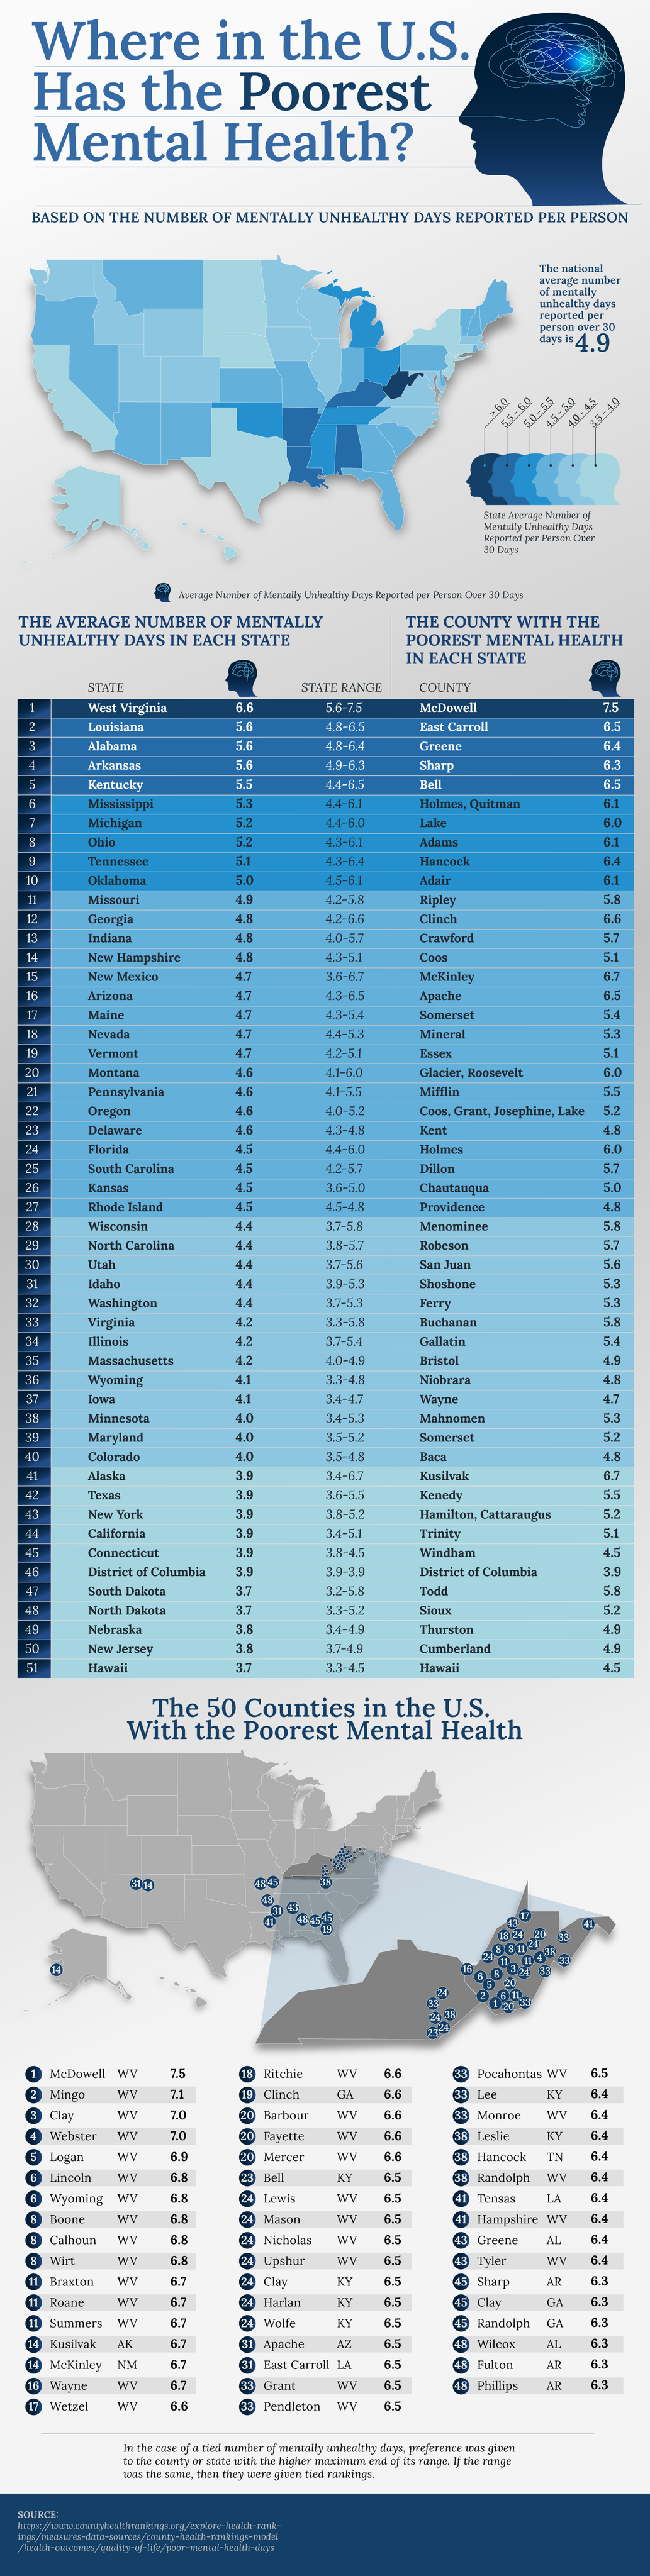
Using data from the 2022 County Health Rankings, we reviewed the average number of mentally unhealthy days reported over 30 days across all of the U.S. counties to find the ones with the worst mental health stats. These averages are based on patients who self-reported their days of poor mental health, so in reality, mental health in America may be even worse, as not everyone feels comfortable being open about their struggles with mental health.
Each State's Average Number of Mentally Unhealthy Days and the County With the Poorest Mental Health
| State | Average Number of Mentally Unhealthy Days Reported per Person Over 30 Days | Range | County With the Poorest Mental Health | Average Number of Mentally Unhealthy Days Reported per Person Over 30 Days | |
|---|---|---|---|---|---|
| 1 | West Virginia | 6.6 | 5.6-7.5 | McDowell | 7.5 |
| 2 | Louisiana | 5.6 | 4.8-6.5 | East Carroll | 6.5 |
| 3 | Alabama | 5.6 | 4.8-6.4 | Greene | 6.4 |
| 4 | Arkansas | 5.6 | 4.9-6.3 | Sharp | 6.3 |
| 5 | Kentucky | 5.5 | 4.4-6.5 | Bell | 6.5 |
| 6 | Mississippi | 5.3 | 4.4-6.1 | Holmes, Quitman | 6.1 |
| 7 | Michigan | 5.2 | 4.4-6.0 | Lake | 6.0 |
| 8 | Ohio | 5.2 | 4.3-6.1 | Adams | 6.1 |
| 9 | Tennessee | 5.1 | 4.3-6.4 | Hancock | 6.4 |
| 10 | Oklahoma | 5.0 | 4.5-6.1 | Adair | 6.1 |
| 11 | Missouri | 4.9 | 4.2-5.8 | Ripley | 5.8 |
| 12 | Georgia | 4.8 | 4.2-6.6 | Clinch | 6.6 |
| 13 | Indiana | 4.8 | 4.0-5.7 | Crawford | 5.7 |
| 14 | New Hampshire | 4.8 | 4.3-5.1 | Coos | 5.1 |
| 15 | New Mexico | 4.7 | 3.6-6.7 | McKinley | 6.7 |
| 16 | Arizona | 4.7 | 4.3-6.5 | Apache | 6.5 |
| 17 | Maine | 4.7 | 4.3-5.4 | Somerset | 5.4 |
| 18 | Nevada | 4.7 | 4.4-5.3 | Mineral | 5.3 |
| 19 | Vermont | 4.7 | 4.2-5.1 | Essex | 5.1 |
| 20 | Montana | 4.6 | 4.1-6.0 | Glacier, Roosevelt | 6.0 |
| 21 | Pennsylvania | 4.6 | 4.1-5.5 | Mifflin | 5.5 |
| 22 | Oregon | 4.6 | 4.0-5.2 | Coos, Grant, Josephine, Lake | 5.2 |
| 23 | Delaware | 4.6 | 4.3-4.8 | Kent | 4.8 |
| 24 | Florida | 4.5 | 4.4-6.0 | Holmes | 6.0 |
| 25 | South Carolina | 4.5 | 4.2-5.7 | Dillon | 5.7 |
| 26 | Kansas | 4.5 | 3.6-5.0 | Chautauqua | 5.0 |
| 27 | Rhode Island | 4.5 | 4.5-4.8 | Providence | 4.8 |
| 28 | Wisconsin | 4.4 | 3.7-5.8 | Menominee | 5.8 |
| 29 | North Carolina | 4.4 | 3.8-5.7 | Robeson | 5.7 |
| 30 | Utah | 4.4 | 3.7-5.6 | San Juan | 5.6 |
| 31 | Idaho | 4.4 | 3.9-5.3 | Shoshone | 5.3 |
| 32 | Washington | 4.4 | 3.7-5.3 | Ferry | 5.3 |
| 33 | Virginia | 4.2 | 3.3-5.8 | Buchanan | 5.8 |
| 34 | Illinois | 4.2 | 3.7-5.4 | Gallatin | 5.4 |
| 35 | Massachusetts | 4.2 | 4.0-4.9 | Bristol | 4.9 |
| 36 | Wyoming | 4.1 | 3.3-4.8 | Niobrara | 4.8 |
| 37 | Iowa | 4.1 | 3.4-4.7 | Wayne | 4.7 |
| 38 | Minnesota | 4.0 | 3.4-5.3 | Mahnomen | 5.3 |
| 39 | Maryland | 4.0 | 3.5-5.2 | Somerset | 5.2 |
| 40 | Colorado | 4.0 | 3.5-4.8 | Baca | 4.8 |
| 41 | Alaska | 3.9 | 3.4-6.7 | Kusilvak | 6.7 |
| 42 | Texas | 3.9 | 3.6-5.5 | Kenedy | 5.5 |
| 43 | New York | 3.9 | 3.8-5.2 | Hamilton, Cattaraugus | 5.2 |
| 44 | California | 3.9 | 3.4-5.1 | Trinity | 5.1 |
| 45 | Connecticut | 3.9 | 3.8-4.5 | Windham | 4.5 |
| 46 | District of Columbia | 3.9 | 3.9-3.9 | District of Columbia | 3.9 |
| 47 | South Dakota | 3.7 | 3.2-5.8 | Todd | 5.8 |
| 48 | North Dakota | 3.7 | 3.3-5.2 | Sioux | 5.2 |
| 49 | Nebraska | 3.8 | 3.4-4.9 | Thurston | 4.9 |
| 50 | New Jersey | 3.8 | 3.7-4.9 | Cumberland | 4.9 |
| 51 | Hawaii | 3.7 | 3.3-4.5 | Hawaii | 4.5 |
- Source: Poor Mental Health Days
- Brain Health: Changing the State of Mental Health Education and Stigma
- NAMI National Alliance on Mental Illness
- Why is cognitive ability associated with psychological distress and wellbeing? Exploring psychological, biological, and social mechanisms
- General Cognitive Brain Support Information